Imagine for a moment that you are responsible for determining how many lake trout can be removed from the northern part of Lake Michigan in the upcoming year without adversely affecting the population’s long-term sustainability. Unfortunately, you don’t have good data on which to base your decision. You aren’t sure how to accurately predict how many young lake trout will reach maturity, and, thus, replace those you allow fishers to remove. You have some historical data, but you know recruitment levels can vary widely from year to year. What happened last year—or even in the past few years—is not necessarily a good indicator of what will happen next year. Pretty tough, right?
The Angle
Now imagine you have two new, validated computer models that can help you predict recruitment levels not only for the entire mixed population of lake trout living in a particular region of the lake, but also for each spawning population that contributes to the mixture. Even better, the new models allow for both minimal and wide variations in recruitment. Wouldn’t that make your decision easier?
Thanks to a recent GLFT project, fisheries managers now have two such models, developed by a team of researchers who wondered if they could find a better way to determine relative recruitments of spawning populations in a mixed environment. The researchers maintained that if they could identify that certain vulnerable populations contributing individuals to a mixture had declining recruitment levels, then fisheries managers could better employ appropriate conservation measures.
The Nitty-Gritty
To develop their models for estimating recruitment, the researchers first programmed their own genetic stock identification (GSI) software. Next, they compared their software to other well-known GSI software to ensure its quality and reliability. Then, they expanded their model to include not only genetic data, but also population dynamic data, such as age (and length as a proxy when age was unknown). This additional data allowed the team to more accurately estimate the recruitment levels of source populations over time, regardless of whether levels were stable or not.
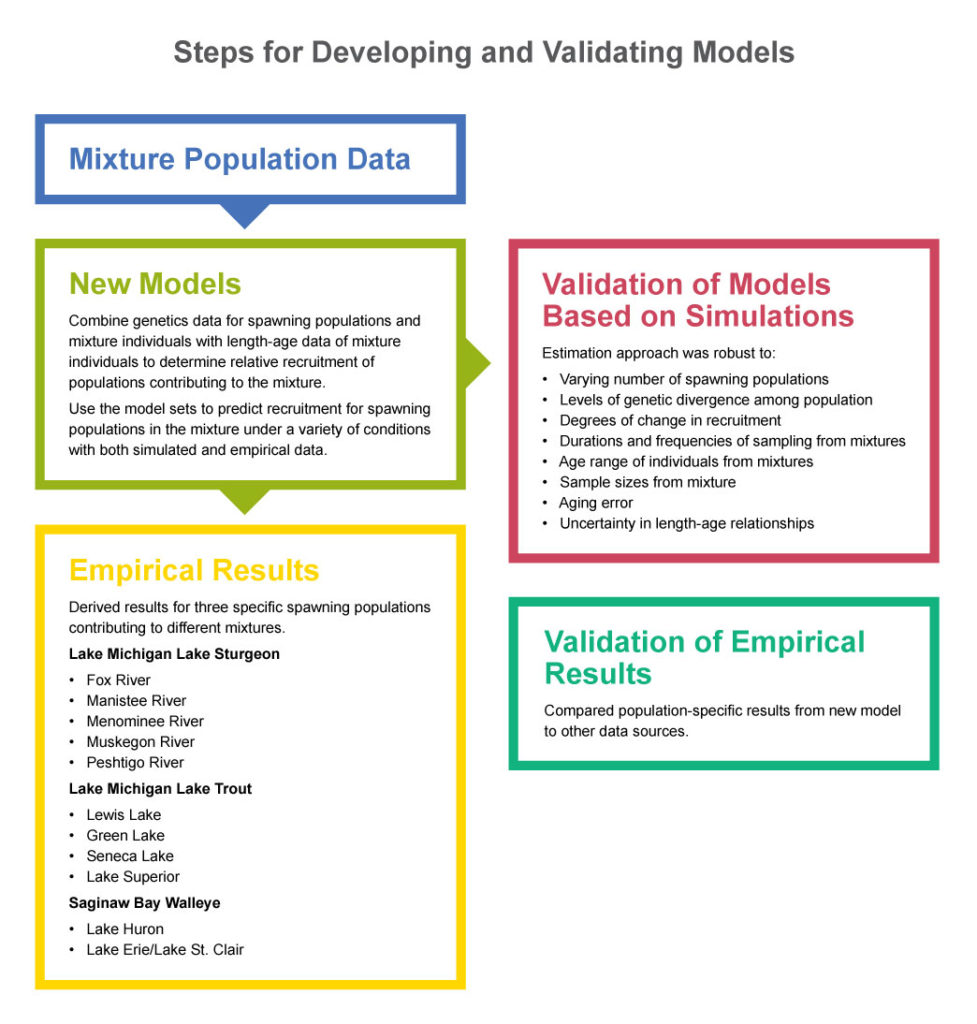
To test their models, the research team used extensive simulations and comparisons between computer-generated and actual data for three populations: (1) lake sturgeon from Green Bay in Lake Michigan (five spawning populations were included), (2) lake trout from northern Lake Michigan (four hatchery strains were included), and (3) walleye from Saginaw Bay in Lake Huron (two spawning populations were included).
The Results Are In…
Through applications and simulations, the research team is confident that its models for estimating recruitment are effective. Both approaches provided reasonably accurate measures of relative recruitment levels across a wide range of conditions. But the research team considers this work a first attempt, and more applications and further exploration are needed.
What Does It All Mean?
One of the greatest challenges fisheries managers face is predicting how certain fish populations will change over time, and, therefore, which management strategies to employ to ensure their long-term sustainability. As a result, new, accurate, and reliable tools that managers can use to inform their decisions are incredibly valuable. Thanks to this recently completed GLFT project, managers now have another tool at their disposal.
Further Reading
Predicting the relative recruitment levels of spawning fish from different populations that mix in a common area is somewhat akin to trying to predict the performance of individual stocks in a mutual fund—there are so many variables to consider that it is extremely difficult to determine which ones will thrive. Therefore, when a new tool comes along to assist experts with analyzing information and making decisions, it is an important and exciting development. Because of a recent Great Lakes Fishery Trust (GLFT) project, fisheries managers now have another such tool.
“Recruitment, along with growth and mortality, dictates sustainability,” says Travis Brenden, an associate professor at Michigan State University (MSU), associate director of MSU’s Quantitative Fisheries Center, and one of the principal investigators on the GLFT project. “Therefore, we need better ways to determine when certain young populations are having recruitment problems—that is, not enough of them are reaching maturity to replace the older fish that are harvested by anglers or die from natural causes.”
But again, estimating the relative recruitment of individual spawning populations in mixed environments isn’t easy.
“The whole purpose of our project was to try to come up with a way to look at individuals in mixed populations and infer back to the population’s health with regard to recruitment,” says Brendan. “If we know, or at least suspect, that certain populations that are contributing individuals to a mixture have declining recruitment levels, then certain conservation efforts might be needed.”
Conversely, if managers know that other populations are reproducing and surviving at high rates, different management strategies may be required.
“Models that can identify stock and cohort contributions to mixed open-water fisheries from routine assessment or harvest data could help managers make better decisions about harvest levels, as well as system-specific stocking programs and habitat restoration efforts,” says Jon Beard, grant manager for the GLFT.
Developing and Validating Models
To develop methods for estimating recruitment, Brenden and the research team first programmed their own genetic stock identification (GSI) software. Then, they compared their software to other well-known and widely used GSI software to see if it worked better than, the same as, or less well than existing options. Essentially, researchers found that the various systems performed similarly (that is, no one program seemed to work best in all situations).
Knowing that their GSI model worked, researchers then expanded it to include not only genetic data, but also population dynamic data, such as age (and length as a proxy when age was unknown).
“People have always acknowledged that contributions of individual populations depend on a lot of factors, such as recruitment, movement rates, and mortality,” Brenden explains. “As these rates vary, so do contribution rates. What we did was to try to come up with ways to explicitly represent those dynamics and tie them to contributions.”
To that end, the research team developed two different models to represent different recruitment dynamics.
“The first model, which was designed for long-lived fish with high prerecruitment and low postrecruitment mortalities, assumes that changes in recruitment are going to be fairly consistent over time,” says Brenden. “You’re not going to have large fluctuations.”
That is in contrast to the second model, which was intended for shorter-lived species, such as walleye, that experience considerable interannual variability in recruitment.
“Walleye are notorious for throwing these huge year classes [number of fish hatched in a given year] out every now and then,” explains Brenden. “You could have multiple low recruitment years, then all of a sudden you have this huge peak where recruitment is ten times higher than in previous years. The way the two methods differ is in how we assume year-class strengths will vary, but the goal is still the same—to try to determine, over time, how recruitment levels of source populations are changing.”
The beauty of this expanded approach, says Brenden, “is that it can be used anywhere—in the Great Lakes, in marine systems, and in other freshwater systems. It essentially has no limits. Any time with any species in any mixed fishery, if you have genetics and age or length information, our approach can be used.”
Putting the Models into Practice
To determine whether the models worked in practice, the research team combined genetic information from spawning populations and individuals from mixtures with age or length data and used its two models to estimate the relative recruitments of the contributing populations. The team did this for three populations: (1) lake sturgeon from Green Bay in Lake Michigan (five spawning populations were included), (2) lake trout from northern Lake Michigan (four hatchery strains were included), and (3) walleye from Saginaw Bay in Lake Huron (two spawning populations were included).
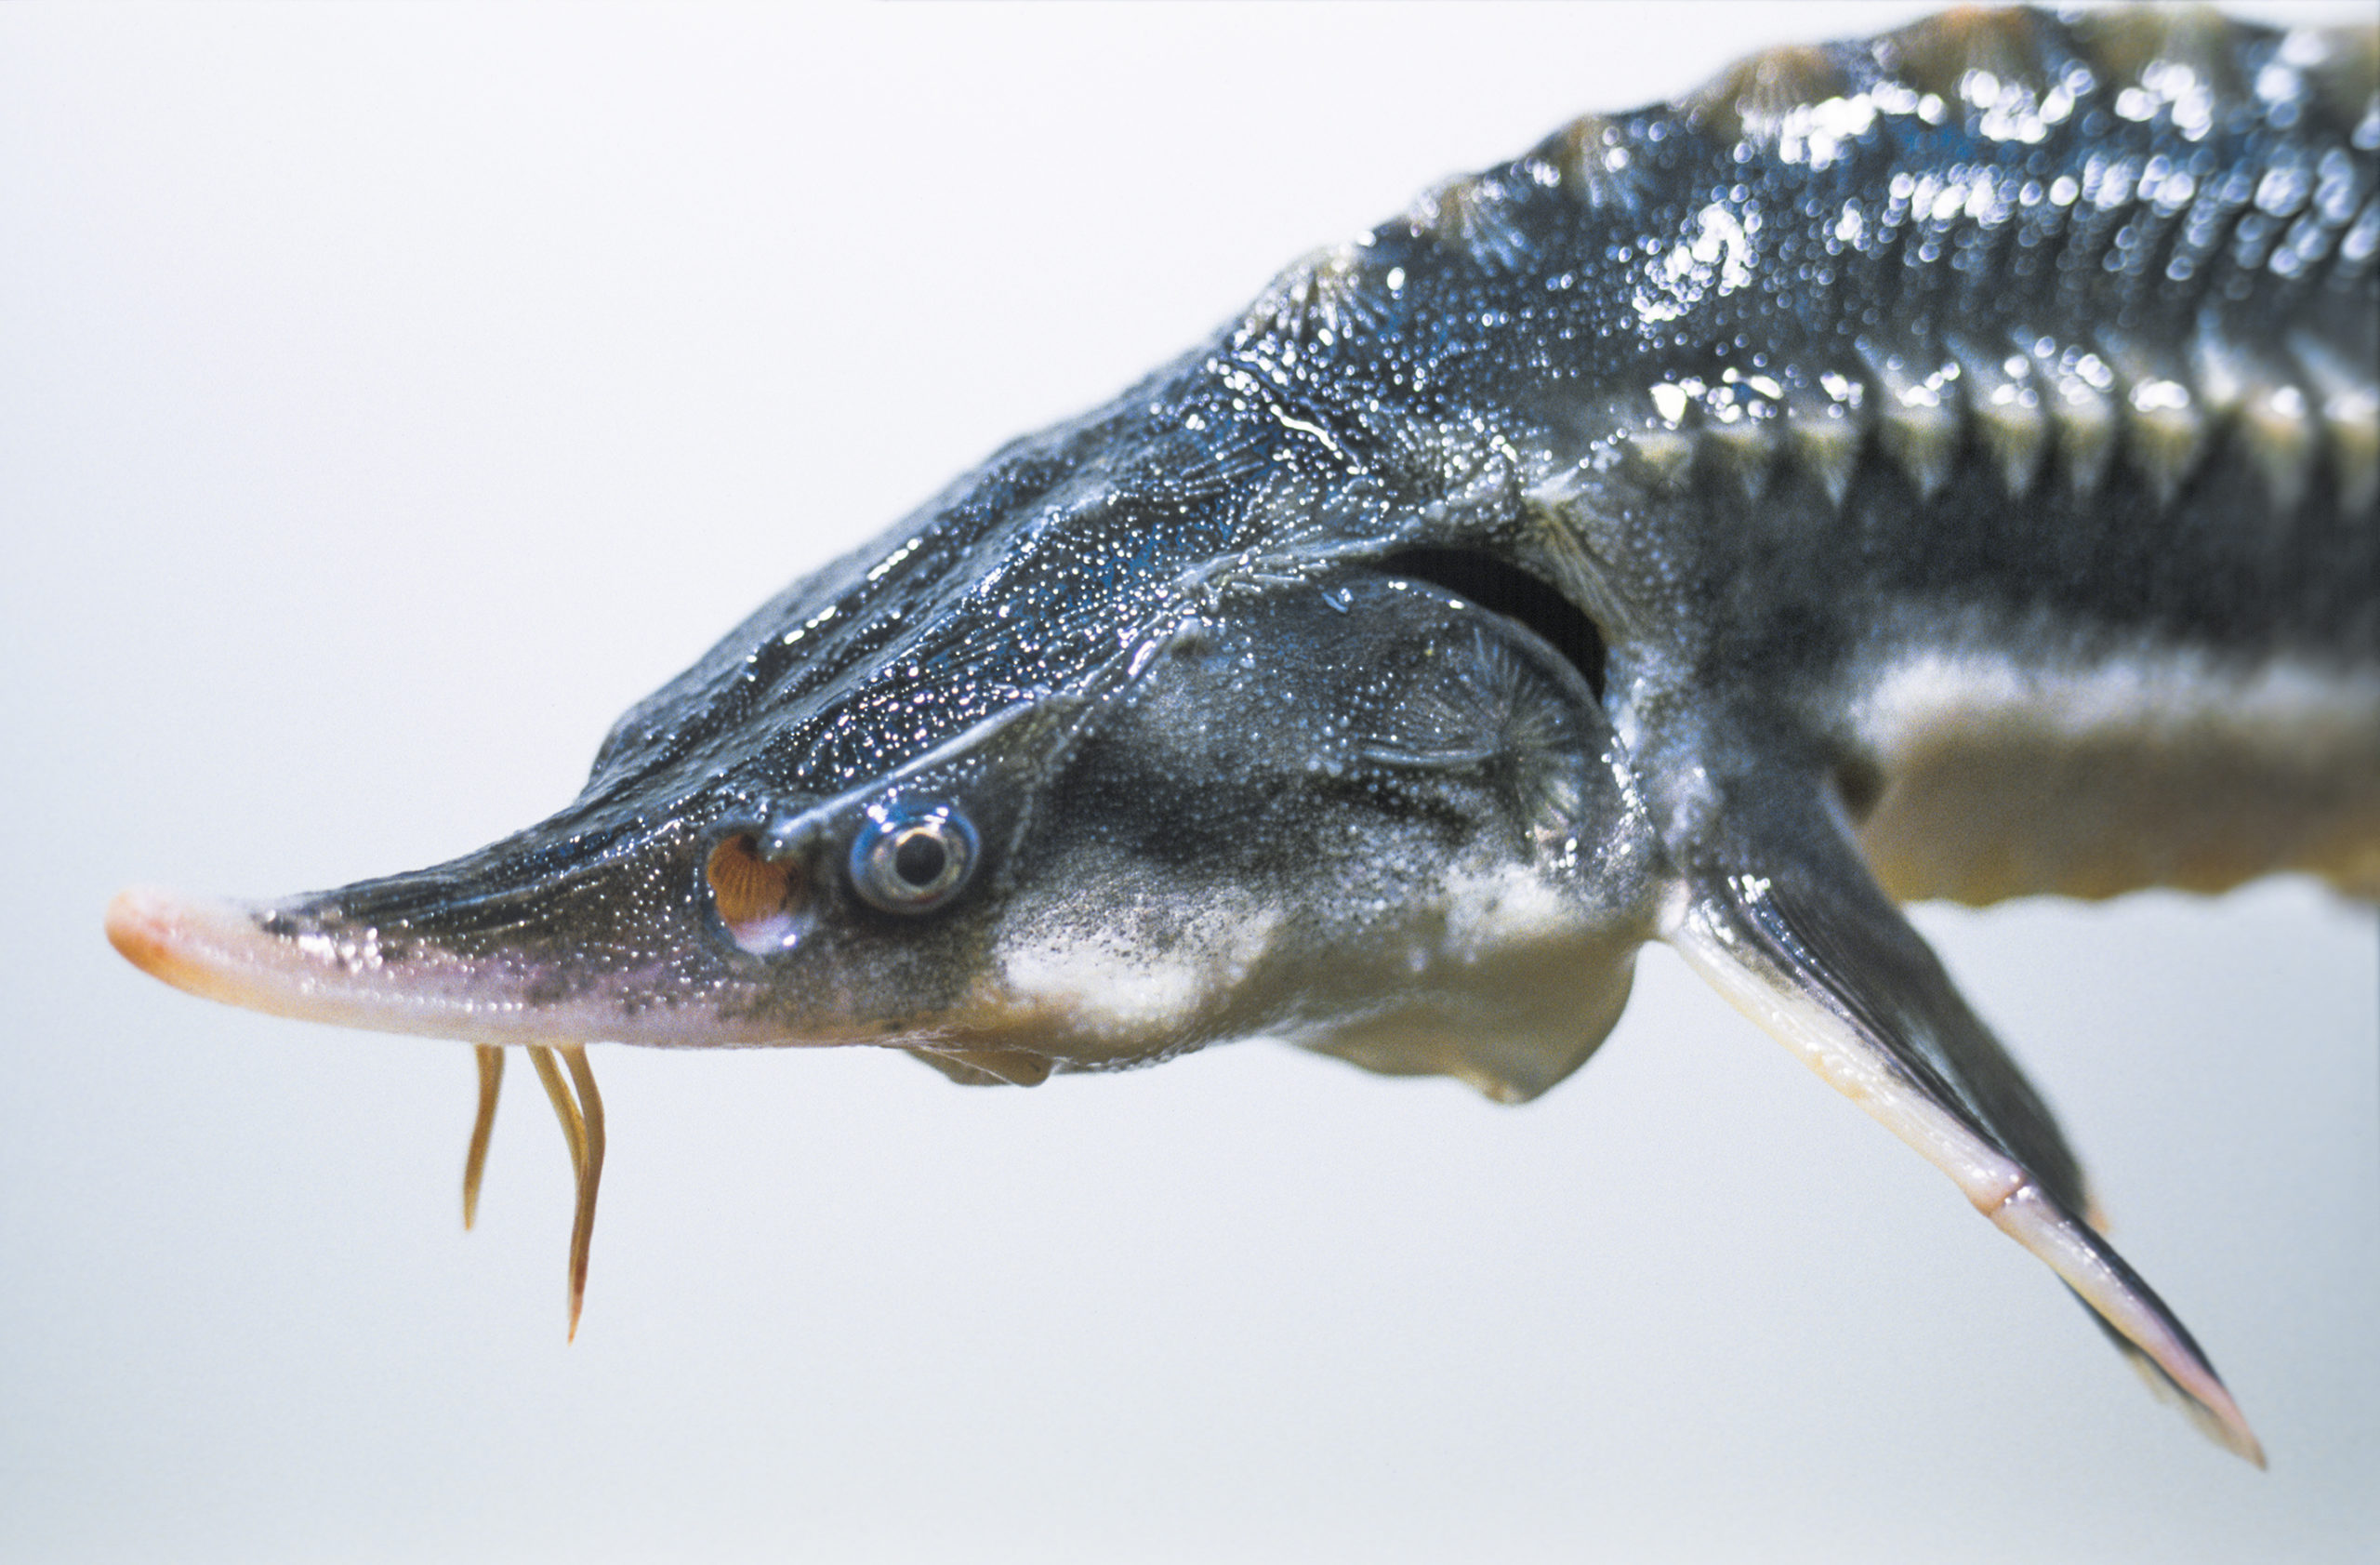
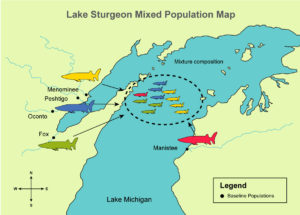
- Data on lake sturgeon indicated that relative recruitment levels from three rivers (Manistee, Muskegon, and Peshtigo) were increasing, while recruitment levels from two rivers (Fox and Menominee) were decreasing. Because this finding has potential management implications, it likely warrants further investigation.
- For lake trout, estimated patterns in relative recruitment matched actual stocking levels for some time periods, but not others.
- Estimated relative recruitment levels for the walleye populations corresponded closely with predicted recruitment levels in some years, but not in others.
Through applications and simulations, the research team is confident that its models for estimating recruitment are effective. Any differences between the team’s results and those from other sources do not indicate a problem with the approach, simply that different assumptions were made.
“I think we’ve been able to demonstrate that our method works,” says Brenden.
According to the final grant report, both approaches provided reasonably accurate measures of relative recruitment levels across a wide range of conditions. But Brenden considers this work a first attempt. He maintains that more applications and further exploration (regarding how well the models work and the situations in which they work best) are needed.
For example, Brenden believes the models could help make sense of the current Chinook salmon situation in the Great Lakes.
“Right now, one of the big things people are thinking about is [the extent to which] Chinook salmon are moving from Lake Huron to Lake Michigan, because that’s where the alewives—the major prey source of Chinook salmon—are,” says Brenden. “That’s an important case where we have different spawning populations mixing together.”
The team’s new models could be used to shed some light on the relative contributions of the two populations, as well as their health.
For those who are interested in exploring the models further, the estimation code developed by Brenden and the research team is now available at no cost through Figshare, a scientific data depository.
